
In my last post, I shared my first dance with AI development, a quick experiment in building an AI-powered chart analysis app with Lovable. It was messy, exciting, and taught me that I could actually prototype with real data. But if this had been a real-world client project? I wouldn’t have started with building. I would have started with mapping.
Dealing with complexity
As a designer, i simplify complexity by mapping it whether it’s user journeys, service blueprints, or just sketching out how different pieces connect. Seeing the whole system before designing any part of it helps.
Lately, I've been wondering how this applies to AI projects. The conversations around AI and design feel so focused on individual interactions or specific use cases. How do we design better prompts? How AI helps to improve the design process? These are important questions, but they feel like they're missing something bigger.
My recent interest with understanding the future of UX design (because according to 90% of Linkedin posts ‘UX Design is dead’) led me to Greg Nudelman's book UX for AI. That's where I discovered something very practical: the Digital Twin Model.
A framework that made sense
A Digital Twin is essentially a mirror of the system you want to build. Instead of jumping into features and screens, you step back and ask: What goes in? What happens in the middle? What comes out?
When I read about this approach, something clicked. It felt like a very practical way to make AI projects less overwhelming and more structured.
So I needed to see what it looked in practice.
The Experiment: Mapping ChartSense Backwards
I decided to apply the Digital Twin model retrospectively to ChartSense. If I had used this approach from the beginning, what would have been different?
To make this more realistic, I simulated what a cross-functional workshop might look like. I asked ChatGPT to role-play as different team members—engineers, data scientists, PMs—and challenged my initial mapping. It actually surfaced questions I wouldn't have thought of alone (not surprising, i know). Which is exactly what should happen in a real team setting.
The important thing is that this Digital Twin isn't the app, it's a sketch of how the app thinks. And because it's framed at a systems level, And because it’s framed at a systems level, it was the best space to name the tough parts early: things like source credibility, bias in how insights are phrased, and accessibility considerations.
The exercise gave me a clearer picture of ChartSense. Here’s how that mapping came together visually. (thanks to my imaginary AI team!)..
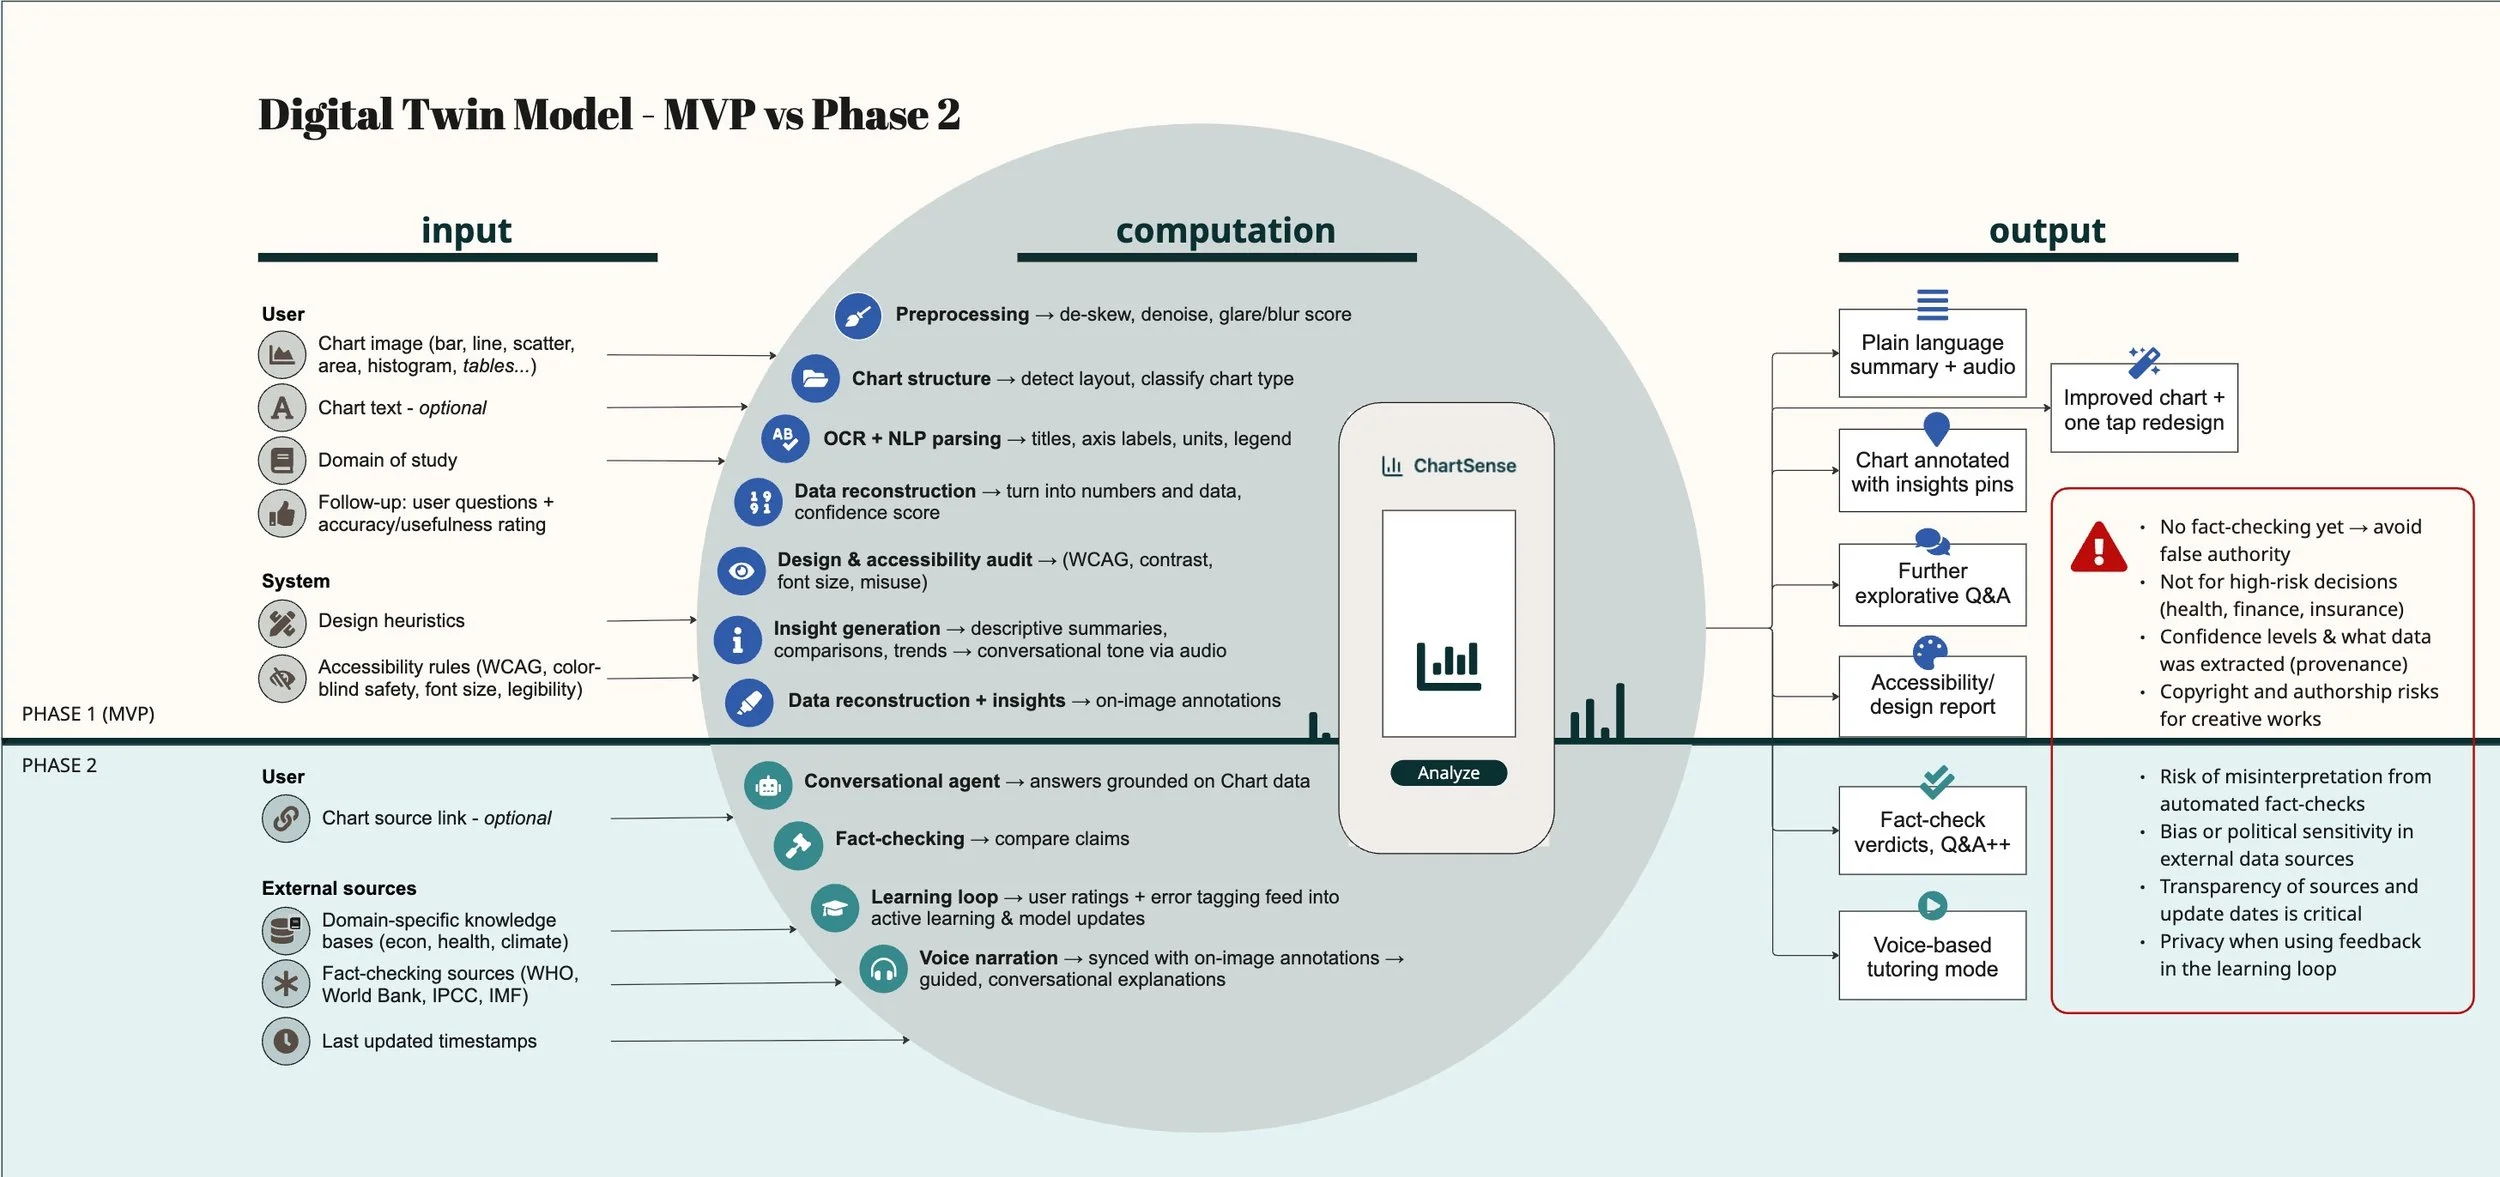
Workshop output: ChartSense Digital TwinModel, a system map for team alignment, showing Phase 1 (MVP) vs Phase 2 scope and key risks. Read left to right. Input: A chart image, either uploaded or captured with a camera. System(computation): Tools that detect chart type, read labels and axes (OCR), reconstruct underlying data, and generate insights. Plus checks for accessibility, design clarity, and fact-checking against known data sources. Output: Plain-language summary, audio narration, design improvement suggestions, and follow-up questions for deeper exploration.
Why is this valuable?
Mapping makes complexity less overwhelming.
Identifying risks early builds trust with users and stakeholders.
It aligns a cross-functional team before anyone writes a line of code.
For me, that’s the power of the Digital Twin: it makes AI projects less intimidating and more structured.
WHAT I’M TAKING FORWARD
This exercise reminded me that mapping is design. Spending time with a framework like the Digital Twin can give us and our team a much clearer picture of what we're actually building. I imagine doing this for a client, then gather real client data, vibe code it to prototype and test with real users. Before even jumping to wireframes. It could be AI concept testing.
For AI projects especially, this kind of almost systems-level thinking feels essential. The challenge isn’t just designing for humans anymore; it’s about how humans and machines interact, how the system scales, and thinking about the ripple effects that create. And yet, not every problem calls for AI. Often the best design choice is the simplest one. The point is to reframe the problem first, then decide if AI belongs in the solution at all.
If you've tried mapping AI projects—or want to experiment with this approach—I'd love to hear how it goes. Because honestly, I'm still figuring this out too, and every experiment teaches me something new.
Appendix - Experimenting on Lovable (Again)
Previously, I used a PRP (Product Requirements Prompt) created in ChatGPT and then fed that directly into Lovable. This time, I uploaded my Digital Twin model to ChatGPT first, fixing the other variables. The difference wasn’t dramatic in every detail, but the core features became much more explicit. For example, the OCR and data reconstruction steps, which last time had been fuzzy and required more aditional work for me to fix, were spelled out more clearly in this iteration.
Before: Core Features (MVP)
Upload/take photo of chart
Automatic chart type detection + plain-language summary
Voice + text output
Suggested clarifying questions
Accessibility & design critique
Related data exploration
After: Core Features
Mobile-first chart capture (camera or upload)
Chart type detection + OCR parsing of labels, axes, units
Data reconstruction + plain-language summaries
Interactive Q&A (freeform + suggested questions)
Voice narration synced with text output
Accessibility & design audit (labels, color contrast, scaling issues)
Improved chart re-render (better design suggestions)
User accounts + saved history of analyses
Deeper analysis powered by Perplexity API (fact-checking, context, related data)